COVID-19 and football: who won the league?
9th May 2020.
The outbreak of COVID-19 has disrupted almost all aspects of life, and sport is no exception. When it comes to football, some leagues are set to resume matches behind closed doors (e.g. Germany’s Bundesliga and South Korea’s K League), while others have been cancelled (e.g. France’s Ligue 1 and Ligue 2 and the Eredivise of the Netherlands).
The status of the English Premier League remains uncertain. In the event that the remaining matches will be cancelled, an important question is how the final positions of teams in the league should be decided. This is particularly important for deciding who should be relegated (and promoted, in the lower leagues) and who should qualify for Europe.
Points-based solutions
Many would see using the league table as it currently stands as unfair, since not all teams have played the same number of games. A popular proposal which accounts for this is points-per-game (PPG), but not many other solutions have been put forward. PPG is certainly a step in the right direction towards a fairer ranking, but does it go far enough?
The answer depends on how the fixture list so far has turned out. If all teams have played each other twice, as in the usual double round-robin format, no team can claim to have been disadvantaged by the fixture list. With some fixtures yet to be played, however, it could be that a team gets lucky and has difficult games cancelled (games which they would have most likely lost), or that a team gets unlucky and misses out on easy games (which they would have most likely won and gained points).
To resolve this potential imbalance, we need a method for calculating the ranking which takes into account the difficuly of fixtures played so far. Instead of 3 points for a win and 1 for a draw in all situations, a win against a strong team should yield higher reward than a win against a weaker team. The notion of ‘strong’ and ‘weak’ teams should also come from the results themselves, so that a team is strong if they beat other strong teams.
Such ranking methods require us to step back from the current league table (and derived ranking methods such as PPG), and instead look at all the results so far as a whole. Methods of this kind are well-studied in the context of tournaments and pairwise comparisons. In this article I will outline how these tournament-based methods can be applied to football leagues, and look at the results of a few ‘off the shelf’ methods on the 2019/20 Premier League (as it stands at the time of writing).
Partial tournaments
A tournament consists of a number of teams and a total ‘beating relation’ between them: for each pair of teams, who won the game? This can be generalised to a ‘weighted tournament’ which allows for draws and multiple games between teams: for each pair of teams \((i, j)\), we have a number \(A_{ij} \ge 0\) representing the score of team \(i\) in matches against team \(j\). Team \(i\) beats \(j\) if \(A_{ij} > A_{ij}\). If there are \(n\) teams, these numbers can be formed into an \(n \times n\) matrix \(A\) called the results matrix.
While I use the terms ‘teams’ and ‘games’ for analogy with football, tournaments can be applied in many different situations beyond sports, e.g. voting (\(A_{ij}\) is 1 if a majority of voters prefer candidate \(i\) to \(j\), and 0 otherwise) and product evaluation (\(A_{ij}\) is 1 if a user prefers \(i\) to \(j\) in a side-by-side comparison, and 0 otherwise).
The 2019/20 Premier League can be seen as a partial weighted tournament, since some comparison between teams are missing (some fixtures are yet to be played and may be cancelled). These missing fixtures are shown in red in the table below. For each cell, the row represents the home team and column the away team. Note that each team has played every other team at least once, so it is only the second fixtures that are missing.
| ARS | AVL | BHA | BOU | BUR | CHE | CRY | EVE | LEI | LIV | MCI | MUN | NEW | NOR | SHU | SOU | TOT | WAT | WHU | WOL | |
|---|---|---|---|---|---|---|---|---|---|---|---|---|---|---|---|---|---|---|---|---|
| ARS | ||||||||||||||||||||
| AVL | ||||||||||||||||||||
| BHA | ||||||||||||||||||||
| BOU | ||||||||||||||||||||
| BUR | ||||||||||||||||||||
| CHE | ||||||||||||||||||||
| CRY | ||||||||||||||||||||
| EVE | ||||||||||||||||||||
| LEI | ||||||||||||||||||||
| LIV | ||||||||||||||||||||
| MCI | ||||||||||||||||||||
| MUN | ||||||||||||||||||||
| NEW | ||||||||||||||||||||
| NOR | ||||||||||||||||||||
| SHU | ||||||||||||||||||||
| SOU | ||||||||||||||||||||
| TOT | ||||||||||||||||||||
| WAT | ||||||||||||||||||||
| WHU | ||||||||||||||||||||
| WOL |

Table 1
Constructing the results matrix
When it comes to forming the results matrix \(A\) from football results, there are many possibilities. In particular, what should the ‘scores’ \(A_{ij}\) represent? An obvious choice is the number of goals (the total number of goals in the case of teams that have played twice already). The resulting matrix \(A^\text{goals}\) is shown below, with the smallest numbers shown in white and the largest in black.
| ARS | AVL | BHA | BOU | BUR | CHE | CRY | EVE | LEI | LIV | MCI | MUN | NEW | NOR | SHU | SOU | TOT | WAT | WHU | WOL | |
|---|---|---|---|---|---|---|---|---|---|---|---|---|---|---|---|---|---|---|---|---|
| ARS | - | 3 | 1 | 2 | 2 | 3 | 3 | 3 | 0 | 1 | 0 | 3 | 5 | 2 | 1 | 2 | 2 | 2 | 4 | 1 |
| AVL | 2 | - | 3 | 2 | 4 | 1 | 0 | 2 | 1 | 1 | 1 | 2 | 2 | 6 | 0 | 1 | 3 | 2 | 0 | 1 |
| BHA | 2 | 2 | - | 3 | 1 | 1 | 1 | 3 | 0 | 1 | 0 | 1 | 0 | 2 | 1 | 0 | 4 | 4 | 4 | 2 |
| BOU | 1 | 4 | 3 | - | 0 | 3 | 0 | 3 | 1 | 1 | 1 | 1 | 1 | 0 | 2 | 3 | 2 | 0 | 2 | 1 |
| BUR | 1 | 3 | 1 | 4 | - | 2 | 0 | 1 | 3 | 0 | 1 | 2 | 1 | 2 | 0 | 5 | 1 | 3 | 3 | 1 |
| CHE | 4 | 2 | 3 | 2 | 7 | - | 2 | 5 | 3 | 1 | 1 | 0 | 1 | 3 | 2 | 4 | 4 | 2 | 0 | 5 |
| CRY | 3 | 1 | 2 | 1 | 2 | 0 | - | 1 | 0 | 1 | 2 | 2 | 1 | 3 | 0 | 1 | 0 | 1 | 4 | 1 |
| EVE | 2 | 0 | 3 | 1 | 1 | 3 | 3 | - | 1 | 2 | 2 | 2 | 4 | 0 | 0 | 2 | 1 | 4 | 3 | 3 |
| LEI | 2 | 8 | 2 | 3 | 3 | 3 | 2 | 2 | - | 1 | 1 | 0 | 8 | 1 | 2 | 10 | 2 | 2 | 6 | 0 |
| LIV | 3 | 2 | 2 | 5 | 3 | 2 | 2 | 5 | 6 | - | 3 | 3 | 3 | 5 | 3 | 6 | 3 | 2 | 5 | 3 |
| MCI | 3 | 9 | 4 | 3 | 4 | 2 | 4 | 5 | 4 | 1 | - | 1 | 2 | 2 | 3 | 2 | 2 | 8 | 7 | 2 |
| MUN | 1 | 2 | 3 | 0 | 2 | 6 | 1 | 2 | 1 | 1 | 4 | - | 4 | 7 | 3 | 1 | 2 | 3 | 0 | 1 |
| NEW | 0 | 0 | 0 | 2 | 0 | 1 | 1 | 3 | 0 | 1 | 2 | 2 | - | 1 | 2 | 3 | 1 | 1 | 3 | 2 |
| NOR | 2 | 1 | 0 | 1 | 0 | 2 | 1 | 2 | 2 | 1 | 3 | 1 | 3 | - | 1 | 1 | 3 | 0 | 0 | 1 |
| SHU | 2 | 2 | 2 | 3 | 3 | 2 | 2 | 2 | 1 | 0 | 0 | 3 | 0 | 3 | - | 0 | 1 | 1 | 2 | 1 |
| SOU | 2 | 5 | 2 | 1 | 1 | 3 | 3 | 1 | 2 | 1 | 1 | 1 | 1 | 2 | 1 | - | 2 | 2 | 1 | 3 |
| TOT | 2 | 6 | 2 | 3 | 6 | 1 | 4 | 1 | 1 | 1 | 4 | 1 | 0 | 4 | 1 | 2 | - | 1 | 3 | 4 |
| WAT | 2 | 4 | 1 | 3 | 0 | 1 | 0 | 2 | 0 | 3 | 0 | 2 | 1 | 2 | 1 | 1 | 1 | - | 1 | 2 |
| WHU | 1 | 0 | 4 | 6 | 0 | 1 | 2 | 1 | 2 | 2 | 0 | 2 | 2 | 2 | 1 | 4 | 2 | 3 | - | 0 |
| WOL | 1 | 2 | 2 | 2 | 1 | 2 | 1 | 2 | 0 | 1 | 5 | 1 | 2 | 5 | 1 | 4 | 4 | 3 | 2 | - |
Table 2
To give an example, the black ‘10’ in Leicester’s row and Southampton’s column means Leicester have scored 10 goals against Southampton (in their 1-2 defeat at home and 0-9 win away). Whilst it is easy to see the high-scoring matches from the colours above, it is hard to get a picture of how each team has performed overall.
Another option is to ignore the margin of victory and use league points for the entries in \(A\) instead of goals: i.e. 3 for a win and 1 for a draw. This is perhaps more in the spirit of the current league ranking system, which only uses the margin of victory for tie-breaking (in the form of goal difference and goals-for). This matrix, denoted \(A^\text{points}\), is shown below.
| ARS | AVL | BHA | BOU | BUR | CHE | CRY | EVE | LEI | LIV | MCI | MUN | NEW | NOR | SHU | SOU | TOT | WAT | WHU | WOL | |
|---|---|---|---|---|---|---|---|---|---|---|---|---|---|---|---|---|---|---|---|---|
| ARS | - | 3 | 0 | 4 | 4 | 1 | 2 | 4 | 0 | 0 | 0 | 4 | 6 | 1 | 1 | 1 | 1 | 1 | 6 | 1 |
| AVL | 0 | - | 4 | 0 | 4 | 0 | 0 | 3 | 0 | 0 | 0 | 1 | 3 | 6 | 0 | 0 | 0 | 3 | 1 | 0 |
| BHA | 3 | 1 | - | 3 | 1 | 1 | 1 | 3 | 0 | 0 | 0 | 0 | 1 | 3 | 1 | 0 | 3 | 4 | 2 | 2 |
| BOU | 1 | 6 | 3 | - | 0 | 4 | 0 | 3 | 0 | 0 | 0 | 3 | 0 | 1 | 1 | 3 | 0 | 1 | 1 | 0 |
| BUR | 1 | 1 | 1 | 6 | - | 0 | 0 | 3 | 3 | 0 | 0 | 3 | 4 | 3 | 0 | 6 | 1 | 3 | 3 | 1 |
| CHE | 4 | 3 | 4 | 1 | 6 | - | 3 | 3 | 2 | 0 | 0 | 0 | 3 | 3 | 1 | 3 | 6 | 3 | 0 | 3 |
| CRY | 2 | 3 | 4 | 3 | 3 | 0 | - | 1 | 0 | 0 | 1 | 3 | 3 | 4 | 0 | 1 | 0 | 4 | 6 | 1 |
| EVE | 1 | 0 | 3 | 0 | 3 | 3 | 4 | - | 0 | 0 | 0 | 2 | 4 | 0 | 0 | 3 | 1 | 6 | 4 | 3 |
| LEI | 3 | 6 | 3 | 3 | 3 | 2 | 3 | 3 | - | 0 | 0 | 0 | 6 | 1 | 3 | 3 | 3 | 3 | 6 | 2 |
| LIV | 3 | 3 | 3 | 6 | 3 | 3 | 3 | 3 | 6 | - | 3 | 4 | 3 | 6 | 6 | 6 | 6 | 3 | 6 | 6 |
| MCI | 3 | 6 | 3 | 3 | 3 | 3 | 4 | 6 | 6 | 0 | - | 0 | 1 | 0 | 6 | 3 | 1 | 3 | 6 | 0 |
| MUN | 1 | 1 | 3 | 0 | 3 | 6 | 0 | 2 | 3 | 1 | 6 | - | 3 | 6 | 1 | 1 | 3 | 3 | 0 | 2 |
| NEW | 0 | 0 | 1 | 3 | 1 | 3 | 3 | 1 | 0 | 0 | 1 | 3 | - | 1 | 3 | 6 | 3 | 1 | 3 | 2 |
| NOR | 1 | 0 | 0 | 4 | 0 | 0 | 1 | 3 | 4 | 0 | 3 | 0 | 4 | - | 0 | 0 | 1 | 0 | 0 | 0 |
| SHU | 4 | 3 | 4 | 4 | 3 | 1 | 6 | 3 | 0 | 0 | 0 | 1 | 0 | 6 | - | 0 | 1 | 2 | 4 | 1 |
| SOU | 1 | 6 | 3 | 0 | 0 | 3 | 4 | 0 | 3 | 0 | 0 | 1 | 0 | 3 | 3 | - | 3 | 3 | 0 | 1 |
| TOT | 1 | 6 | 3 | 3 | 4 | 0 | 3 | 1 | 0 | 0 | 4 | 0 | 0 | 4 | 1 | 3 | - | 2 | 3 | 3 |
| WAT | 1 | 3 | 1 | 4 | 0 | 0 | 1 | 0 | 0 | 3 | 0 | 3 | 1 | 3 | 2 | 0 | 2 | - | 0 | 3 |
| WHU | 0 | 1 | 2 | 4 | 0 | 3 | 0 | 1 | 0 | 0 | 0 | 3 | 0 | 3 | 1 | 6 | 0 | 3 | - | 0 |
| WOL | 1 | 3 | 2 | 3 | 1 | 0 | 1 | 0 | 2 | 0 | 6 | 2 | 2 | 6 | 1 | 4 | 3 | 3 | 3 | - |
Table 3
This matrix is a bit easier to interpret, since the numbers involved fall into a narrower range. For example, the fact that Liverpool’s row is very dark tells us that they have scored points against many teams, whilst their column is mostly zeros, telling us that few teams have scored points against them.
Of course, the two methods discussed here are not the only methods available for constructing the results matrix. For example we could assign higher weights to away goals, assign different weights to draws vs wins etc. In the rest of this article I will mostly focus on \(A^\text{points}\).
Tournament ranking methods
Given a results matrix \(A\), our task is to rank the teams according to how well they did. As mentioned in the introduction, the way we do this in a partial tournament may differ from the complete tournament setting. For example, we may wish to take into account the difficulty of the teams a certain team has had to face.
There have been many different approaches put forward for such ranking methods. My main reference here is this excellent paper by Julio González-Díaz et. al. which analyses 9 methods. Here I will focus on just a few of them, sketching out the main ideas without diving too much into the formal details. Note that these are methods for general tournaments, not specifically for football. Modifications could be made in places to better match the nuances of football, but I will not do so in this article.
Neustadtl. Originating as a tie-breaking method for chess, this method assign higher reward for beating a good team, compared to beating a weak team. First, let \(m_i\) denote the total score in games involving team \(i\):
For \(A^\text{goals}\) this just means \(m_i\) is \((\text{goals for} + \text{goals against})\); for \(A^\text{points}\) \(m_i\) is \(3 \cdot (\text{wins} + \text{losses}) + 2 \cdot \text{draws}\).
Next, ‘average scores’ \(s_i\) are calculated for each team \(i\) by diving \(i\)’s total score by \(m_i\):
This is an initial assessment of each team which accounts for the fact that not all teams have played the same number of games. Finally, the Neustadtl score \(r^n_i\) for team \(i\) is a weighted sum of the average scores of \(i\)’s opponents:
Note that the points team \(i\) receives for its score against team \(j\) is proportional to the initial score \(s_j\) of team \(j\).
Maximum likelihood. This method takes a probabilistic view of ranking and applies maximum likelihood estimation. In the ranking context this method is also known as the Bradley-Terry model.
It is worth noting now that the following basic model has been extended specifically for football rankings in David Firth’s alt-3 method. His variant properly accounts for draws and the home game advantage, making it undoubtedly better suited to the present problem. For simplicity here, though, I present the more generic method for tournaments in general.
The central idea here is to suppose each team \(i\) possesses a true ‘skill rating’ \(r_i\), which is unknown a priori. Given a vector \(r\) of such skill ratings, we define the probability that team \(i\) would beat team \(j\) in terms of the standard logistic function \(f\): [1]
Note that this value is 0.5 when \(r_i = r_j\), gets close to 1 quickly as \(r_i\) becomes larger than \(r_j\), and gets close to 0 as \(r_i\) becomes smaller than \(r_j\).
Assuming that the results of matches are sampled independently, each assignment of ratings gives a probability distribution over the results across the whole season. This means that when given a specific results matrix \(A\), we can judge the appropriateness of a ratings vector \(r\) by looking at \(P(A \mid r)\) – i.e. the probability that we would observe the results in \(A\) if the true ratings were \(r\). In the usual spirit of maximum likelihood estimation, we rank teams according to their rating in the \(r^\text{ML}\) which maximises this probability.
To illustrate with an example, take just the first three teams of the 19/20 season alphabetically: Arsenal (ARS), Aston Villa (AVL) and Brighton (BHA). Using the \(A^\text{points}\) matrix above, we have the following fixtures with the winners in bold. [2]
ARS vs AVL
ARS vs BHA
AVL vs BHA
The following demo simulates 5,000 leagues between these three teams, using the ratings in the textboxes. As might be expected since each team has the same number of wins and losses in this mini-league, the probability is maximised when all three teams have the same rating. Each of the 8 possible league outcomes are equally likely in this case, so the maximal probability is 1/8 = 0.125.
Of course, the results look very different once the matches with the other 17 teams are taken into account.
Recursive performance. This method comes from a paper of Brozos-Vázquez et. al. To better understand the intuition behind it, first consider the Performance method from the same paper.
Here we assume the availability of an initial score \(r_i\) for each team \(i\) (based on historical data from previous tournaments, for example). Let \(v_i\) be a weighted average of the initial scores of team \(i\)’s opponents, where the weight for team \(j\) depends on the proportion of \(i\)’s games against \(j\):
Like the Bradley-Terry model, Performance uses the standard logistic function \(f(x) = 1 / (1 + \exp(-x))\). The Performance score for team \(i\) is the unique number \(r^\text{perf}_i\) such that
where \(s_i\) is as defined above for the Neustadtl method. This means that \(r^\text{perf}_i\) is greater than the average opponent score \(v_i\) when \(s_i > 0.5\) (and \(r^\text{perf}_i\) rapidly becomes large as gets \(s_i\) closer to 1), and smaller when \(s_i < 0.5\).
This method crucially depends on the initial scores for each team, which may not be always be available. Additionally, it might be desirable to rank teams based on the results of the tournament alone, without using extra information in the form of the initial scores. To get around this while preserving the spirit of Performance, the Recursive performance method finds the solution \(r^\text{r-perf}\) to \((*)\) which uses the vector \(r^\text{r-perf}\) itself to construct the average opponent scores \(v_i\):
That is, the score for team \(i\) depends on the average score of \(i\)’s opponents, which in turn depends on the scores for their opponents and so on. The extra term \(\lambda\) is required to ensure that a solution exists, and does not affect the ordinal ranking of teams. [3]
Fair bets. The Fair bets scores vector \(r^\text{fb}\) satisfies, for each \(i\),
The above equation has a unique non-zero solution up to multiplication by a constant; we take the solution whose entries sum to 1.
The intuition is as follows. Suppose we are betting on the league points (in the case of \(A^\text{points}\)) or goals (in the case of \(A^\text{goals}\)) in matches involving team \(i\). If team \(i\) gains a point/goal against team \(j\), we win \(£(100 \cdot r_j)\), and we lose \(£(100 \cdot r_i)\) for each point/goal against team \(i\). The Fair bets solution is the one where we break even for every team: the amount won is equal to the amount lost.
Note that this captures the idea that wins against good teams should be rewarded highly. If team \(i\) beats many other good teams, the expected payout is high, which means the expected loss (proportional to \(r^\text{fb}_i\)) needs to also be high.
19/20 Season Analysis
We have now seen several ranking methods. What results do they give on the actual 19/20 season data? The following graph shows the scores output by each method using the \(A^\text{points}\) results matrix. In addition to the tournament-based ranking methods, the graph shows the current league table points and points-per-game (PPG). The clubs are sorted according to the current league table points.
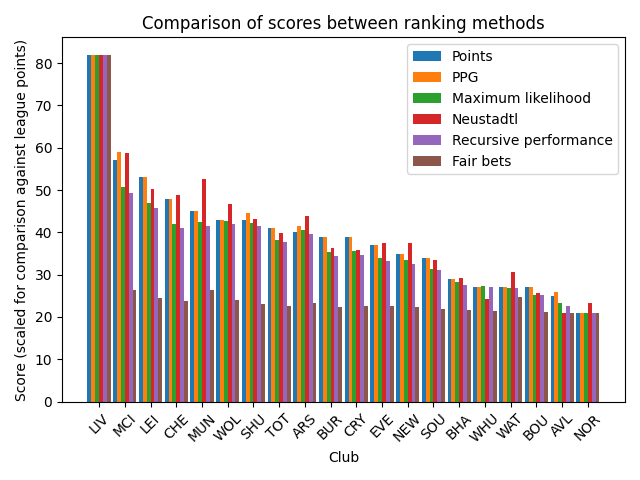
Figure 1
The scores for each method have been rescaled in this graph to match the range of league points; this does not affect their relative ordering and is done only to aid comparison between methods. [4]
A quick glance shows that the various methods tend to agree with league points: the scores generally get smaller as we go to the right. There are some noteworthy changes if we look at the rankings, however. The following table shows the rankings according to each method, along with the position change relative to the current league table (scroll to the right to see all methods on mobile).
| Points | PPG | Maximum likelihood | Neustadtl | Recursive performance | Fair bets | |
|---|---|---|---|---|---|---|
| 1 | LIV | LIV | LIV | LIV | LIV | LIV |
| 2 | MCI | MCI | MCI | MCI | MCI | MCI |
| 3 | LEI | LEI | LEI | MUN (+2) | LEI | MUN (+2) |
| 4 | CHE | CHE | WOL (+2) | LEI (-1) | WOL (+2) | WAT (+13) |
| 5 | MUN | MUN | MUN | CHE (-1) | MUN | LEI (-2) |
| 6 | WOL | SHU (+1) | SHU (+1) | WOL | SHU (+1) | WOL |
| 7 | SHU | WOL (-1) | CHE (-3) | ARS (+2) | CHE (-3) | CHE (-3) |
| 8 | TOT | ARS (+1) | ARS (+1) | SHU (-1) | ARS (+1) | ARS (+1) |
| 9 | ARS | TOT (-1) | TOT (-1) | TOT (-1) | TOT (-1) | SHU (-2) |
| 10 | BUR | BUR | CRY (+1) | NEW (+3) | CRY (+1) | TOT (-2) |
| 11 | CRY | CRY | BUR (-1) | EVE (+1) | BUR (-1) | EVE (+1) |
| 12 | EVE | EVE | EVE | BUR (-2) | EVE | CRY (-1) |
| 13 | NEW | NEW | NEW | CRY (-2) | NEW | BUR (-3) |
| 14 | SOU | SOU | SOU | SOU | SOU | NEW (-1) |
| 15 | BHA | BHA | BHA | WAT (+2) | BHA | SOU (-1) |
| 16 | WHU | WHU | WHU | BHA (-1) | WHU | BHA (-1) |
| 17 | WAT | WAT | WAT | BOU (+1) | WAT | WHU (-1) |
| 18 | BOU | BOU | BOU | WHU (-2) | BOU | BOU |
| 19 | AVL | AVL | AVL | NOR (+1) | AVL | NOR (+1) |
| 20 | NOR | NOR | NOR | AVL (-1) | NOR | AVL (-1) |
Table 4
Looking at the different ranking methods, both Neustadtl and Fair bets see fairly dramatic changes: only 4 teams remain in the same position compared to the league table. The biggest individual change by far is Watford ascending 13 positions in Fair bets; going from near-relegation in the current league table to qualifying for Europe under Fair bets.
This makes the Fair bets ranking highly questionable. Indeed, looking at the scores assigned by Fair bets in Figure 1, we see there is very little variation amongst all teams except Liverpool, suggesting that Fair bets is sensitive to outliers in the tournament and ‘squishes’ all other teams together in the presence of them. [5] This could mean that small variations in the tournament matrix would result in large changes to the rankings – not a desirable property.
It is worth noting that Watford is the only team to see such a major shift in ranking, despite being equal on points with both West Ham and Bournemouth. This seems to be because Watford are the only team to have beaten Liverpool (and one of the two teams to at least draw), who in turn have played well against almost all other teams. The principle that a team should receive extra reward for beating good teams seems to be at play here, and works in Watford’s favour.
Finally, note that the rankings of Maximum likelihood and Recursive performance happen to coincide exactly in this case.
We can also look how individual teams (or pairs of teams) fare across the different rankings:
Manchester United overtake Chelsea in all rankings except in the current table and PPG. Chelsea also move down even below Wolves in all tournament-based methods except Neustadtl. This suggests Chelsea may have an unfair advantage in the points-based rankings.
Arsenal and Tottenham switch positions in all rankings except the current table, including PPG. This is interesting given the strong rivalry between the two teams!
Wolves and Sheffield United – currently equal on points with Wolves ahead on goal difference – switch positions when using PPG. Interestingly, all the tournament-based methods preserve the league table ranking between the two teams, and in fact widen the gap between them. This might suggest that while Sheffield have gained more points per game, they have faced easier fixtures than Wolves.
All ranking methods except Neustadtl are in agreement on the bottom three teams, i.e. the teams that will (potentially) be relegated.
Looking at historical data
Whilst comparison against the current (incomplete) league table is interesting, it will not tell us which one method is best to actually use. After all, if the incomplete table was desirable we would just use that…
Assume for now that the ‘best’ ranking is the one that would come from the league table if all the fixtures could be played. One way to get a sense for how desirable the tournament-based ranking methods are is to look to historical data: by running each method on ‘partial seasons’ and comparing the resulting ranking to the known end-of-season table, we can see how well each method predicts the eventual desired ranking.
To test this, I obtained Premier League results from the 1999/2000 season through to 2018/2019 from football-data.co.uk. I then ran each ranking method at 50 evenly-spaced points throughout each season, [6] and calculated the swap distance (also called Kendall-tau distance) between the resulting ranking and the end-of-season table. The graph below shows the mean swap distance at each time-step for each ranking method. Note that the \(A^\text{points}\) tournament matrix was used.
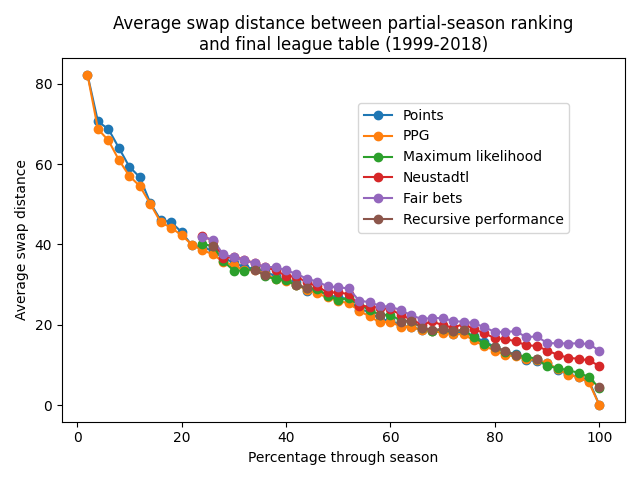
Figure 2
A few observations are in order. Firstly, note that the data for the tournament-based methods does not start until over 20% of the way through the season. This is because these methods, as defined in the González-Díaz paper, require that the results matrix \(A\) be irreducible. That is, there cannot be two teams who are not connected via games played against other teams. [7]
Secondly, observe that on average none of the four tournament-based methods used here coincide with the end-of-season league table, even when taking all fixtures into account. This reflects the differing intuitions and motivations behind the tournament-based methods. It also depends on how the results matrix \(A\) is constructed, and whether this construction agrees with the ‘three points for a win’ system of the points-based ranking. Other methods such as alt-3 do take the three-points system into account, and are guaranteed to agree with the league table once all games have been played. In fact, the alt-3 method is already largely in agreement with many league tables in Europe, despite the missing fixtures.
On the results themselves, all methods follow the same roughly linear trajectory through the middle of the season before diverging near the end. Maximum likelihood and Recursive performance are the closest to the end-of-season league table, with Neustadtl and Fair bets further away. That Fair bets is the least similar to the end-of-season ranking is perhaps unsurprising given the results in Table 4!
Conclusions
This article has looked at ranking football teams through the lens of partial tournaments, which goes beyond simply looking at the aggregated results of the season so far via the league table. It’s interesting to see how the results differ and how they stay the same. I’m sure a more in-depth analysis of particular teams via these methods could give some useful insights into how they have played so far this season.
So, what conclusions can actually be drawn about who should win the league? Who should be relegated? Based on the results shown in Figure 1 it seems uncontroversial to say that Liverpool should be declared the winners, but the bottom three teams are less clear cut. All ranking methods considered here agree that Aston Villa and Norwich are the two lowest-ranking teams, although Neustadtl and Fair bets rank them in the opposite order compared to the other methods. The third lowest team is Bournemouth in all rankings except Neustadtl, so taking the ‘majority wins’ point of view, it is Aston Villa, Norwich and Bournemouth that should be relegated. Interestingly, this coincides with the current league table and PPG.
Whether these ranking methods should actually be used beyond just the top and bottom teams, however, is a separate issue. Any method used in practise should surely be easy to understand as a first priority, and also explainable; I don’t think many people would claim this is the case for the methods considered in this article. Going back to the rankings of Table 4, take West Ham and Neustadtl as an example. How would we explain to West Ham that, despite being 16th in the official league, they should actually drop two position and be relegated according to Neustadtl? I’ll leave these kind of questions for another day.
Note: all the code used to generate the results in this article is available on GitHub.